I am not a good designer. Generally I have problems with colors and fonts and all that stuff. Many times my approach is to find some good theme, be it for Vim or for data visualization and then use it everywhere without thinking to much about it.
That is how I've found Nord Theme. I used it for my Vim setup. And now I have ported it to an R theme to be used with ggplot.
About the Nord Theme
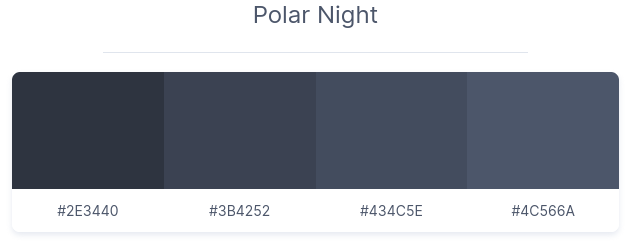
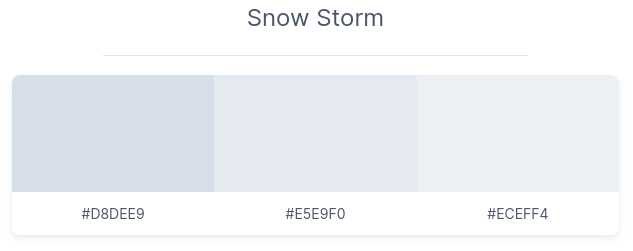
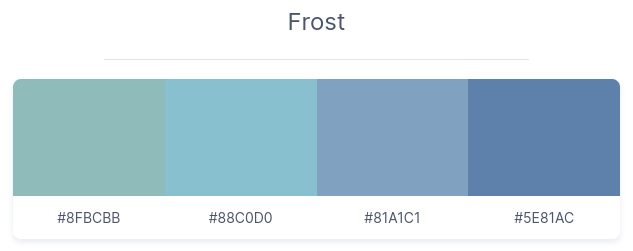
The setup is simple. Nord theme has 16 colors and 4 main plattes:
Polar Night
Snow Storm
Frost
Aurora
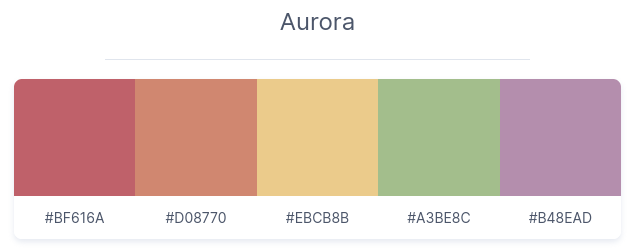
Polar Night and Snow Storm can be used for backgroundand text elements. Frost and Aurora can be used for coloring and highlighting, which makes them suitable for ggplot charts.
nordtheme
I am working on this small project about server logs analysis and affter long pause I was happy to pick up R again (majority of my projects are in Python, unfortunately).
While make pretty basic ggplot charts for logs analysis I, as is typical for me, started to think that my charts should probably look a certain way not ggplot defaults. So I've created this nordtheme package.
You can find it at my forge here
The idea is simple. Have two modes - dark and light. This is controled by theme_nord function.
There are options for discrete, continuous, diverging and semantic scales:
scale_colour_nord_dscale_fill_nord_dscale_colour_nord_cscale_fill_nord_cscale_colour_nord_dscale_fill_nord_dscale_colour_nord_statusscale_fill_nord_status
All in all, a very simple and basic implementation of a theme.
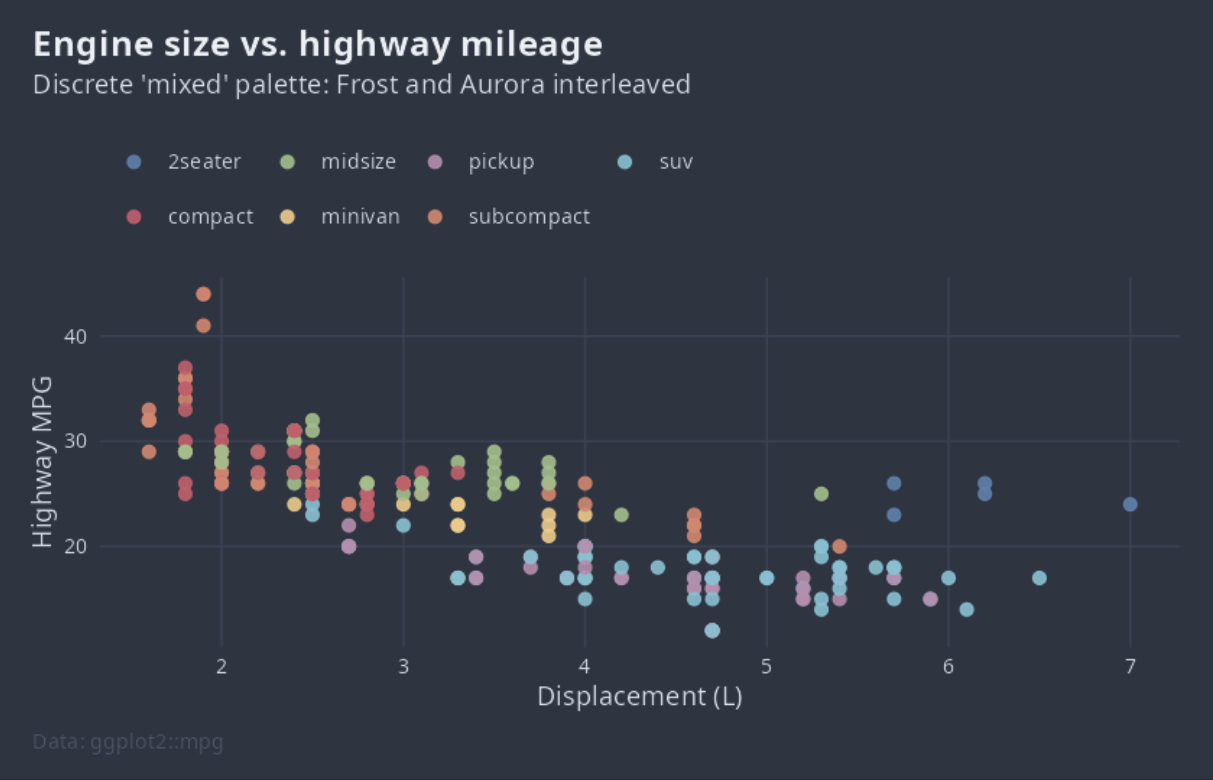
Here is how it look in ggplot charts:
library(ggplot2)
library(nordtheme)
# Discrete colours: scatter by group
ggplot(mpg, aes(displ, hwy, colour = class)) +
    geom_point(size = 2.2, alpha = 0.9) +
    scale_colour_nord_d() +
    labs(title = "Engine size vs. highway mileage",
         subtitle = "Discrete 'mixed' palette: Frost and Aurora interleaved",
         x = "Displacement (L)", y = "Highway MPG", colour = NULL,
         caption = "Data: ggplot2::mpg") +
    theme_nord("dark")
This code produces this:
Anywas, that is all for a short intro to my new nordtheme. Feel free to browse for more examples and source code in the repository.