Week covers data from 2026-11-07 to 2026-11-13. Tracking app is here
Here is the summary of the week.
| Requests | IPs | 200 | 403 | abort |
|---|---|---|---|---|
| 37557 | 7908 | 10592 / 28% | 950 / 3% | 4132 / 11% |
I have implemented some new abort rules in my Caddyfile so abort has seen a spike which is expected.
Very low 200 number is probably an evidence that traffic to my pages is really mostly noise rather than legitimate humans visiting.
Three key statuses that I am tracking are just a tiny portion of what server replies with (most of that is 404).
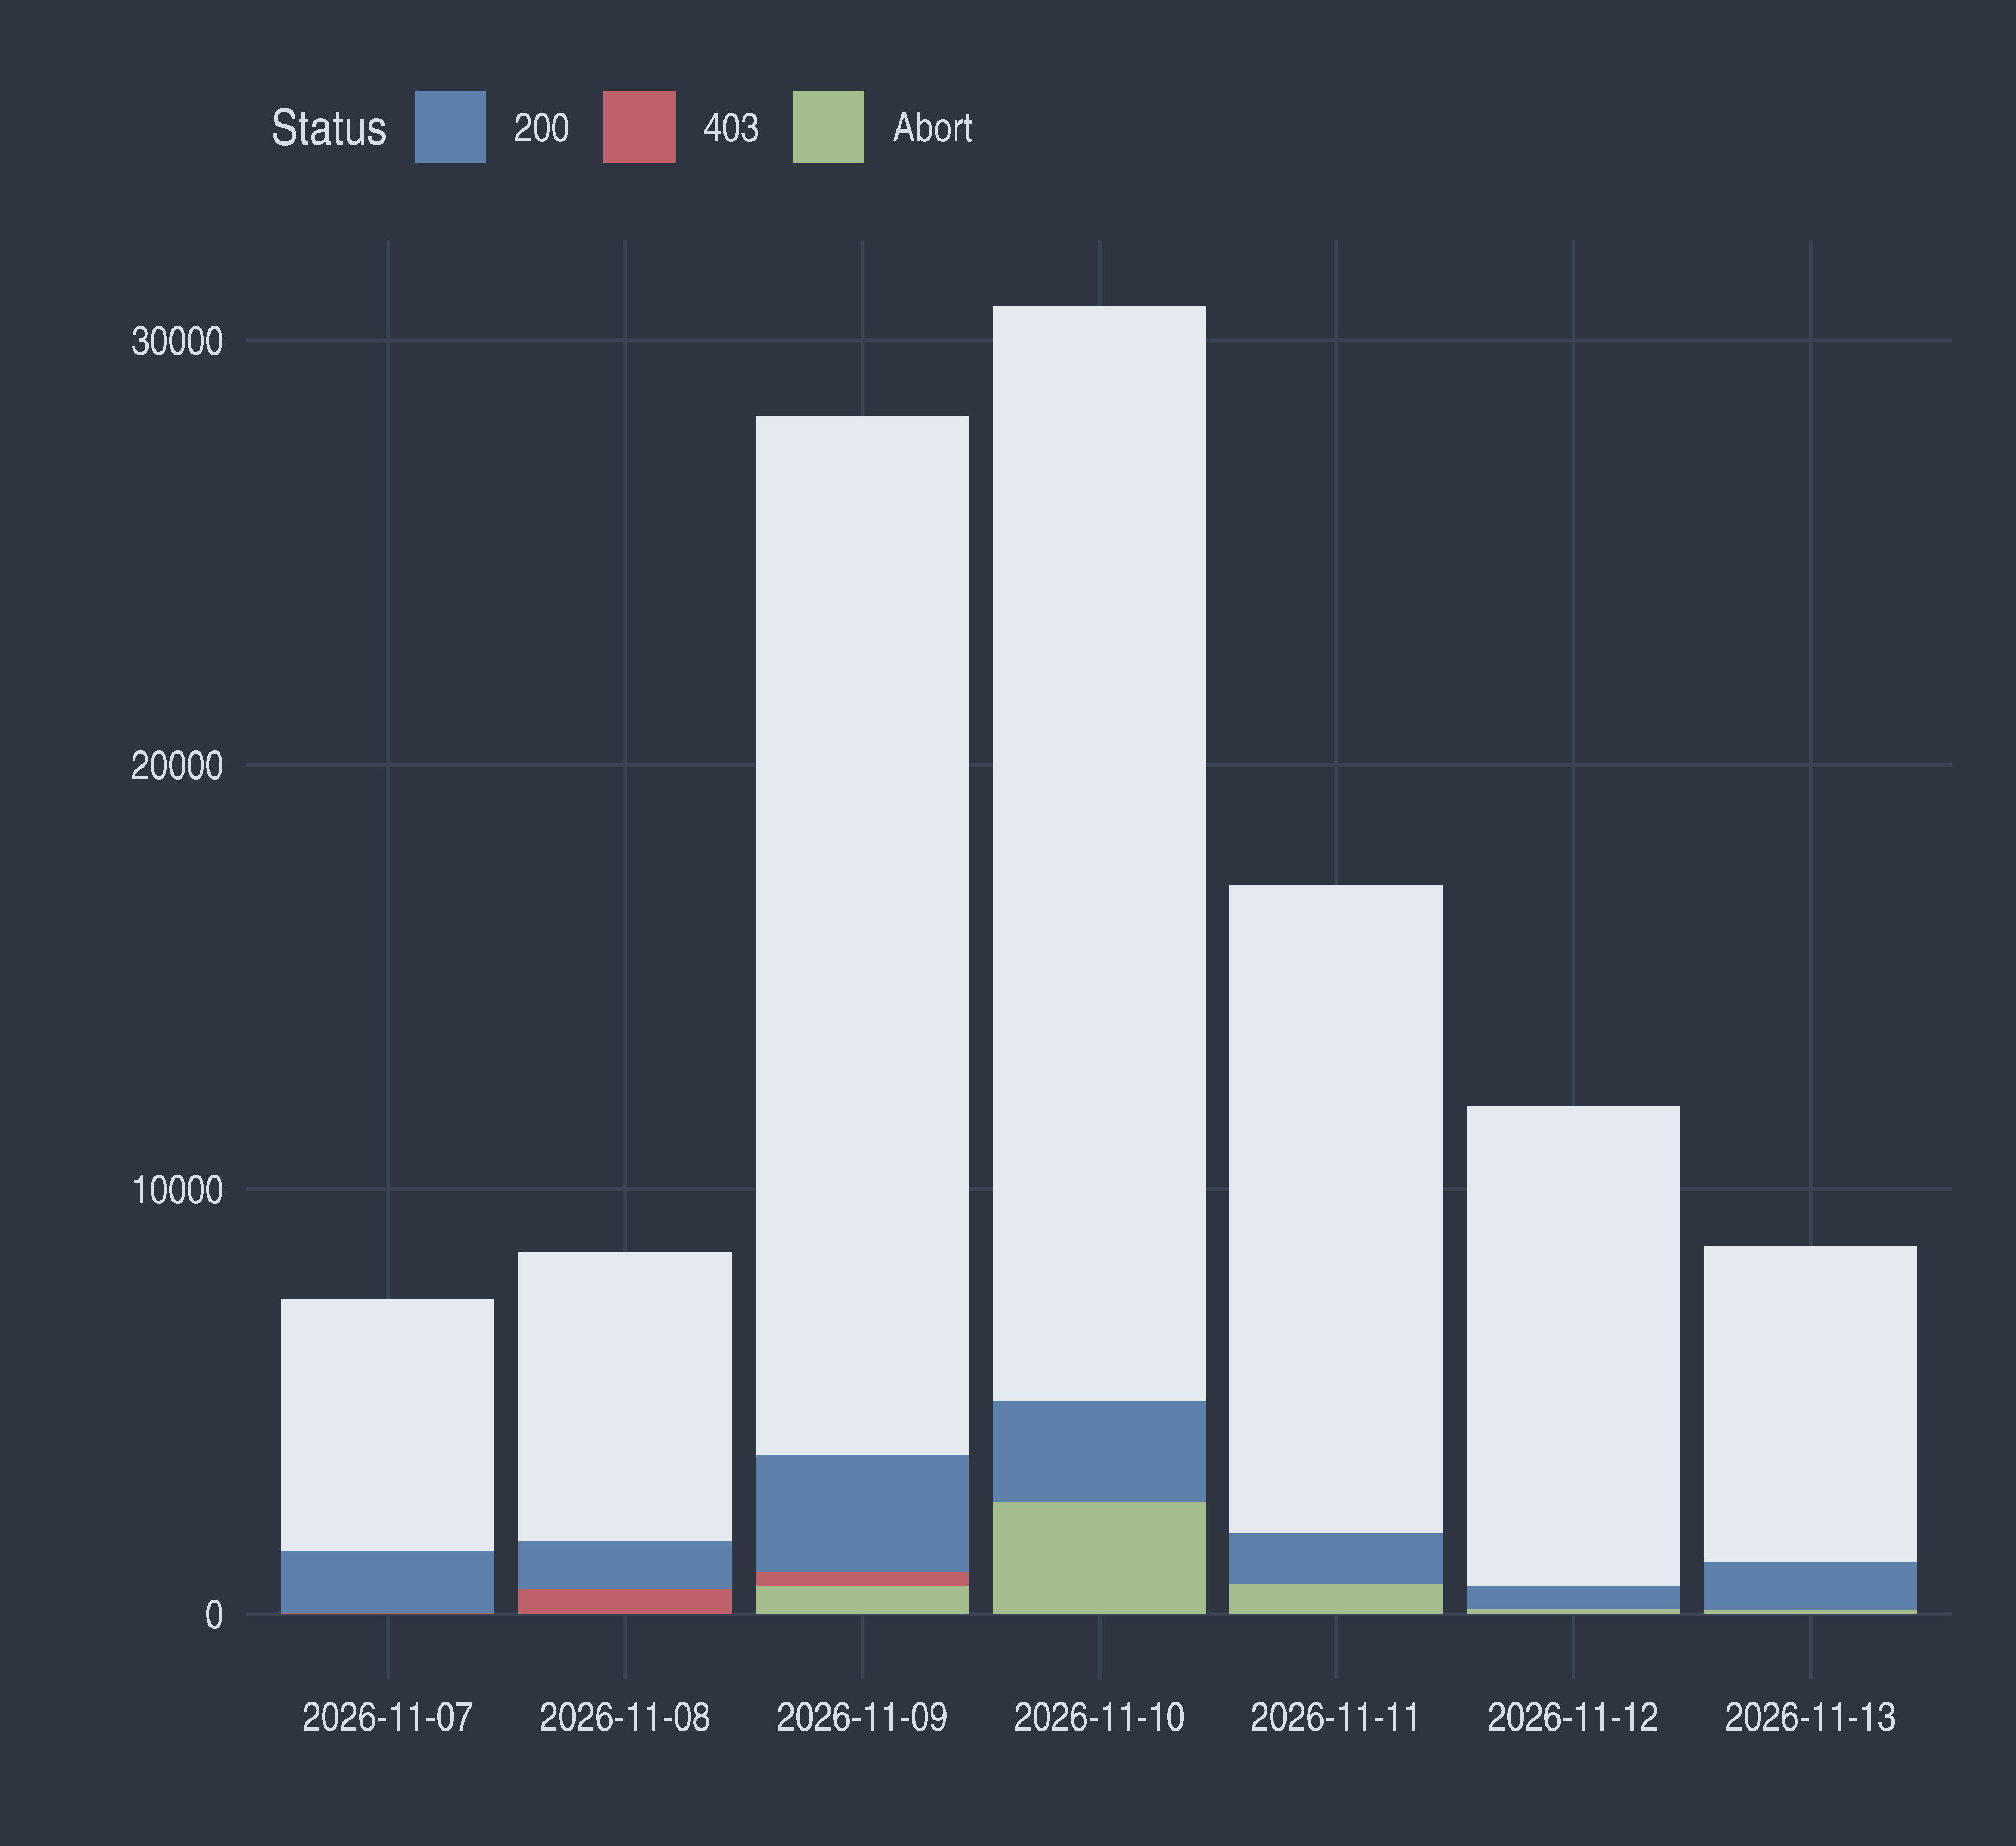
Another side of this is that requests are often not directed to a particular page but
just probing the server for different things.
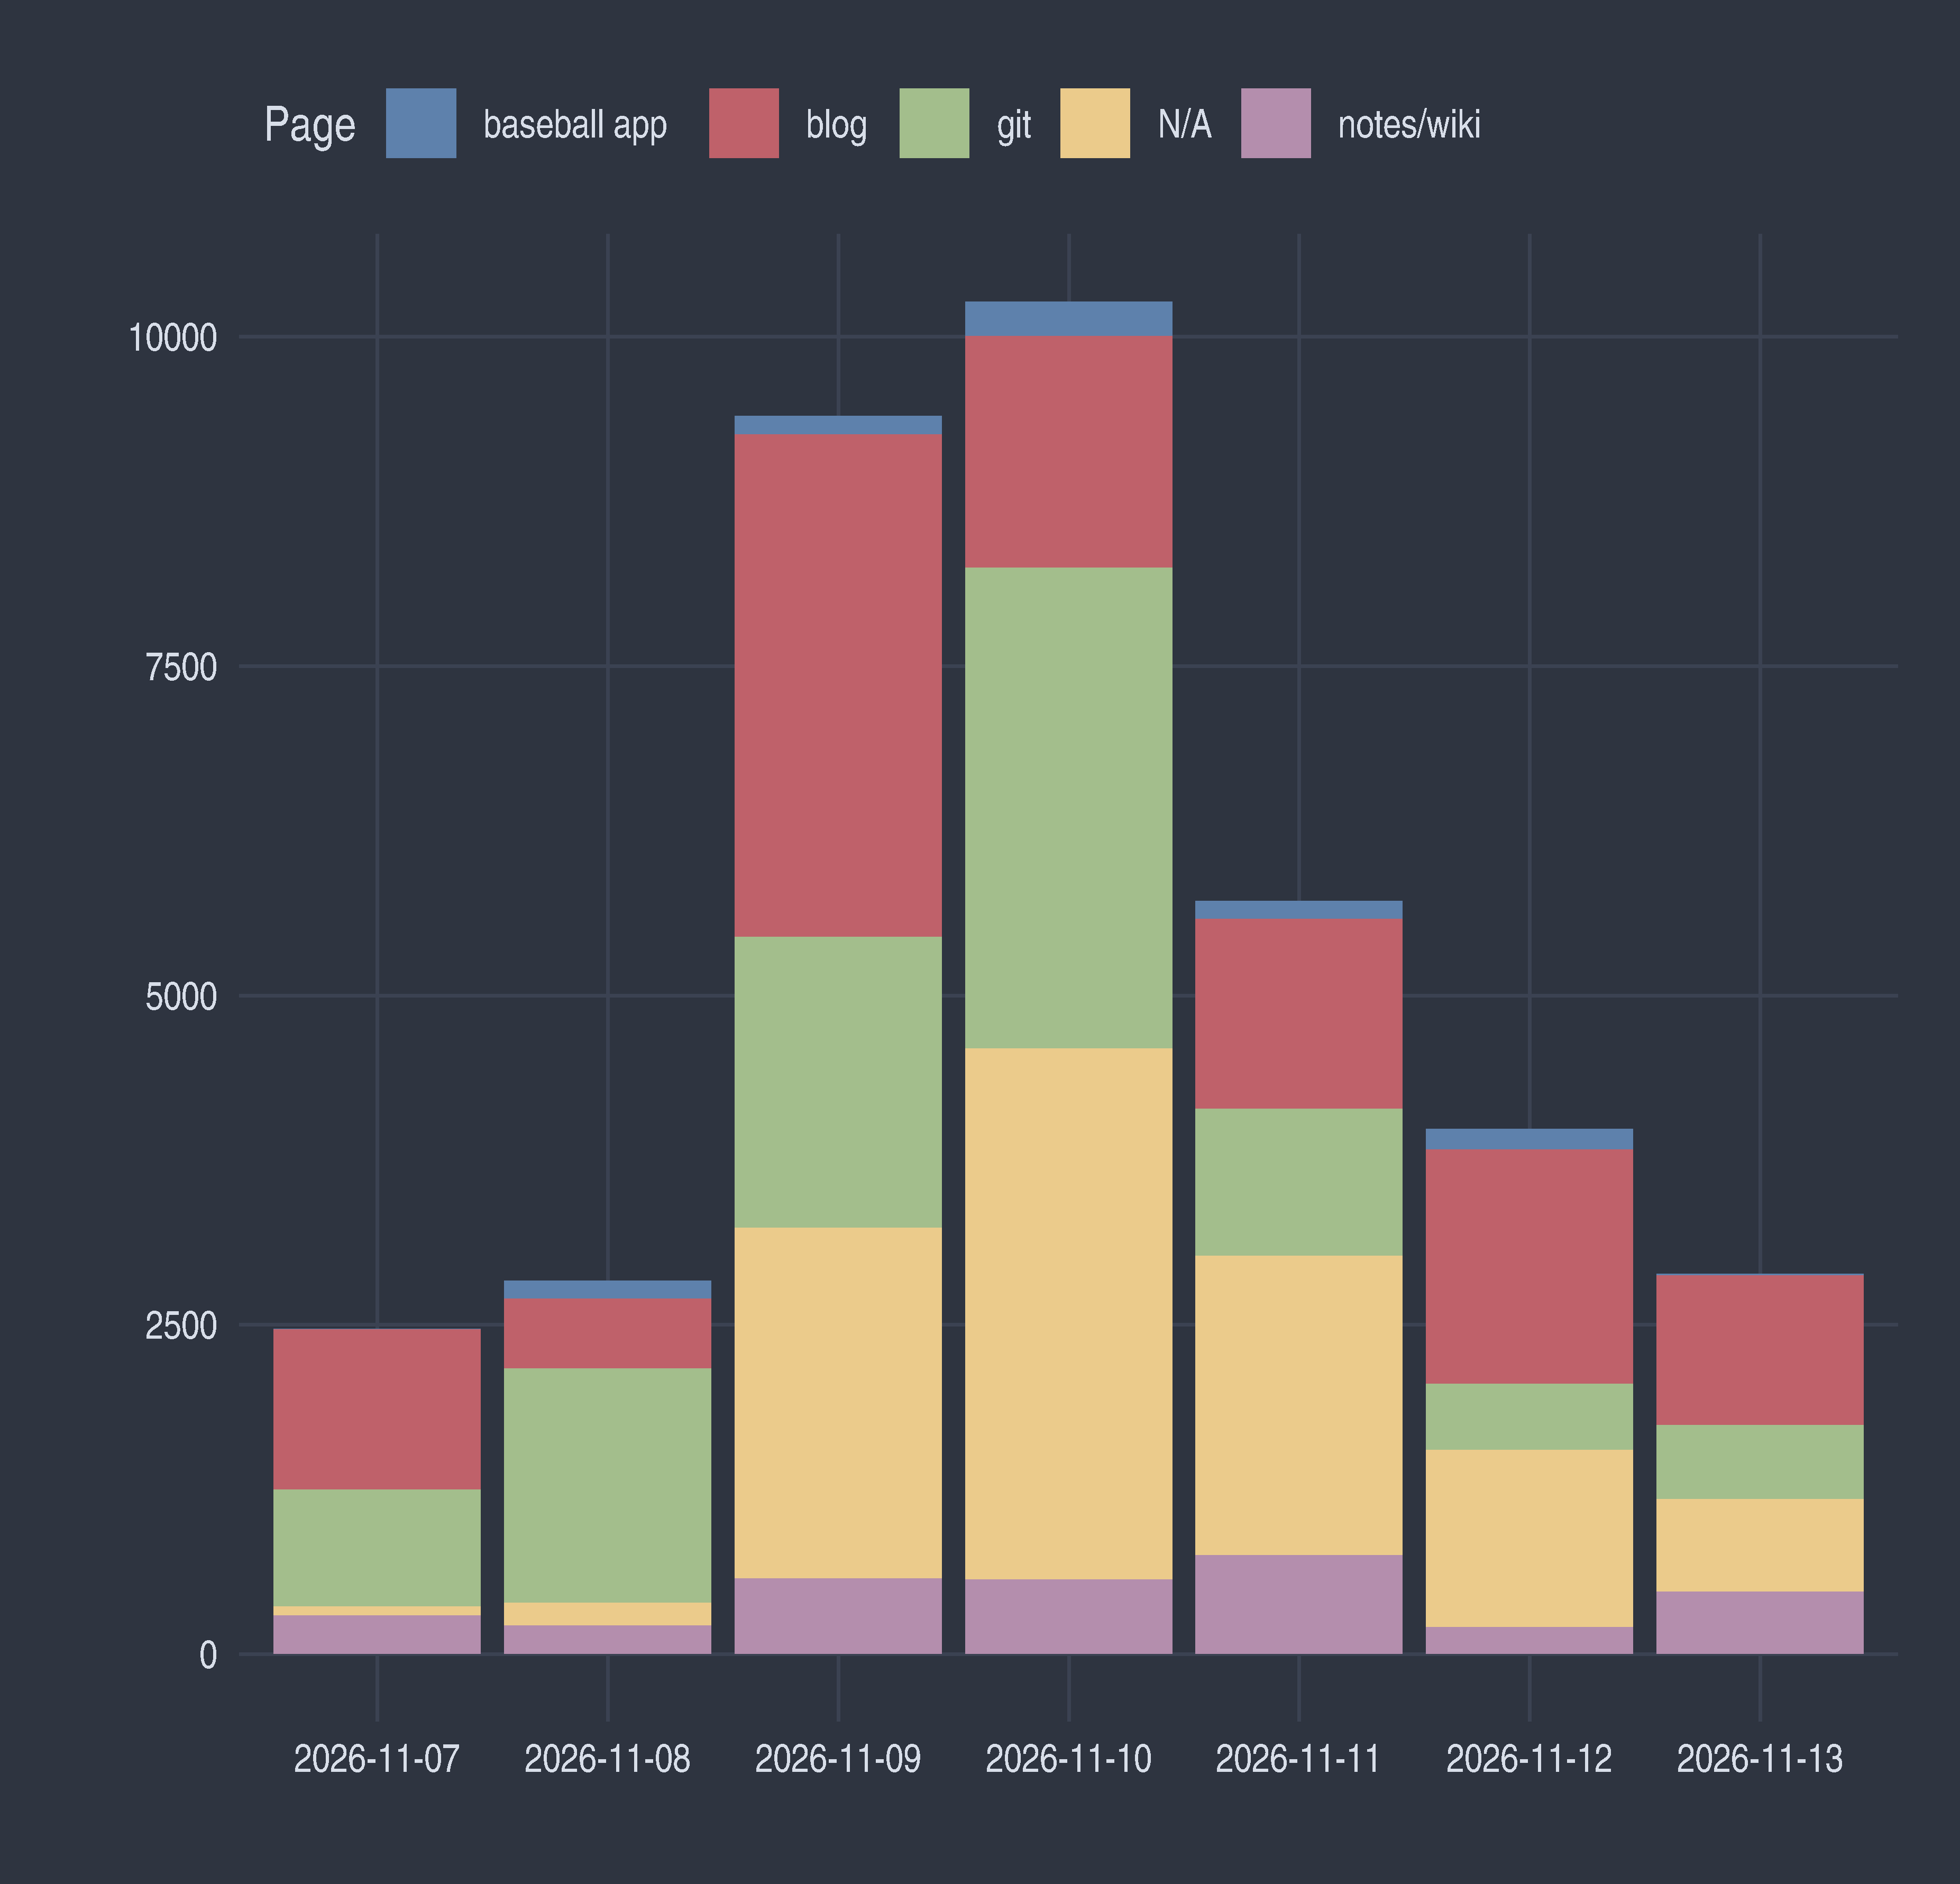
Top URIs requests shows this well:
| URI | Requests | IPs |
|---|---|---|
| /wp-admin/install.php?step=1 | 321 | 118 |
| /.git/config | 230 | 92 |
| /.env | 198 | 86 |
| /assets/css/theme-forgejo-auto.css?v=17.0.1~gitea-1.22.0 | 195 | 187 |
| /assets/js/index.js?v=17.0.1~gitea-1.22.0 | 186 | 176 |
| /assets/js/webcomponents.js?v=17.0.1~gitea-1.22.0 | 180 | 169 |
| /assets/css/index.css?v=17.0.1~gitea-1.22.0 | 167 | 158 |
| /assets/css/repo-branch-tag-selector.d9ca1da2.css | 123 | 120 |
| /assets/js/repo-branch-tag-selector.f396185d.js | 115 | 112 |
| /.env.local | 114 | 60 |
| /api/session/properties | 106 | 10 |
| /wp-login.php | 89 | 34 |
| /.env.production | 87 | 59 |
| /api/.env | 84 | 55 |
| /.env.backup | 82 | 55 |
| /info.php | 80 | 56 |
| /app/.env | 79 | 50 |
| /.env.development | 78 | 51 |
| /.env.save | 78 | 50 |
| /.env.staging | 77 | 50 |
Most of it is just probing for Wordpress, env files.
AI Crawlers identified by IP ranges were not very active this week, showing measly numbers accrosse the board.
| Crawler | IPs | Avg Time Span | Requests | Per IP |
|---|---|---|---|---|
| claude_crawl | 15 | 13226.000000 secs | 155 | 10 |
| meta_crawl | 60 | 203.605275 secs | 86 | 1 |
| openai_train | 16 | 817.812500 secs | 82 | 5 |
| amazon_train | 33 | 0.000000 secs | 37 | 1 |
| apple_crawl | 22 | 0.318199 secs | 36 | 2 |
| openai_search | 8 | 0.000000 secs | 11 | 1 |
IPs Spike
From November 9 to November 11 there was a spike in number of IPs that visited. The main actors are displayed here:
| ASN | Handle | Events | IPs |
|---|---|---|---|
| AS45102 | ALIBABA-CN-NET | 23110 | 2550 |
| AS132203 | TENCENT-NET-AP-CN | 15900 | 819 |
| AS9808 | CHINAMOBILE-CN | 3180 | 270 |
| AS13335 | CLOUDFLARENET | 2625 | 181 |
| AS4837 | CHINA169-BACKBONE | 1860 | 165 |
Multiple IP ranges were hitting me from AS45102.
Most of it went to git instance where they were surfing deep through all the public repos.
I cannot prove that this is all one actor. Seems like they were methodically going through
all the endpoints, then found git instance.
| CIDR | Host | Requests | IPs |
|---|---|---|---|
| 47.80.0.0/13 | git | 17470 | 1947 |
| 47.78.0.0/15 | git | 5525 | 599 |
| 47.89.128.0/17 | blog | 60 | 2 |
| 198.11.128.0/18 | blog | 30 | 2 |
| 47.80.0.0/13 | notes/wiki | 15 | 3 |
| 47.254.0.0/16 | blog | 5 | 1 |
| 47.77.128.0/17 | baseball app | 5 | 1 |
I could not identifiy that these were bots, not from User-Agent at least but the almost even spread between majority of those UAs probably means that it was an automated thing.
| User-Agent | Requests |
|---|---|
| Mozilla/5.0 (Macintosh; Intel Mac OS X 10_15_7) AppleWebKit/537.36 (KHTML, like Gecko) Chrome/153.0.0.0 Safari/537.36 | 1100 |
| Mozilla/5.0 (Macintosh; Intel Mac OS X 10_15_7) AppleWebKit/537.36 (KHTML, like Gecko) Chrome/151.0.0.0 Safari/537.36 | 1135 |
| Mozilla/5.0 (Windows NT 10.0; Win64; x64) AppleWebKit/537.36 (KHTML, like Gecko) Chrome/152.0.0.0 Safari/537.36 | 1215 |
| Mozilla/5.0 (Macintosh; Intel Mac OS X 10_15_7) AppleWebKit/537.36 (KHTML, like Gecko) Chrome/152.0.0.0 Safari/537.36 | 1175 |
| Mozilla/5.0 (Windows NT 10.0; Win64; x64) AppleWebKit/537.36 (KHTML, like Gecko) Chrome/148.0.0.0 Safari/537.36 | 1085 |
| Mozilla/5.0 (Macintosh; Intel Mac OS X 10_15_7) AppleWebKit/537.36 (KHTML, like Gecko) Chrome/148.0.0.0 Safari/537.36 | 1150 |
| Mozilla/5.0 (Windows NT 10.0; Win64; x64) AppleWebKit/537.36 (KHTML, like Gecko) Chrome/145.0.0.0 Safari/537.36 | 1080 |
| Mozilla/5.0 (Windows NT 10.0; Win64; x64) AppleWebKit/537.36 (KHTML, like Gecko) Chrome/146.0.0.0 Safari/537.36 | 1130 |
| Mozilla/5.0 (Windows NT 10.0; Win64; x64) AppleWebKit/537.36 (KHTML, like Gecko) Chrome/151.0.0.0 Safari/537.36 | 1265 |
| Mozilla/5.0 (Macintosh; Intel Mac OS X 10_15_7) AppleWebKit/537.36 (KHTML, like Gecko) Chrome/150.0.0.0 Safari/537.36 | 1065 |
| Mozilla/5.0 (Windows NT 10.0; Win64; x64) AppleWebKit/537.36 (KHTML, like Gecko) Chrome/153.0.0.0 Safari/537.36 | 1095 |
| Mozilla/5.0 (Windows NT 10.0; Win64; x64) AppleWebKit/537.36 (KHTML, like Gecko) Chrome/149.0.0.0 Safari/537.36 | 1055 |
| Mozilla/5.0 (Macintosh; Intel Mac OS X 10_15_7) AppleWebKit/537.36 (KHTML, like Gecko) Chrome/149.0.0.0 Safari/537.36 | 1205 |
| Mozilla/5.0 (Macintosh; Intel Mac OS X 10_15_7) AppleWebKit/537.36 (KHTML, like Gecko) Chrome/144.0.0.0 Safari/537.36 | 1250 |
| Mozilla/5.0 (Macintosh; Intel Mac OS X 10_15_7) AppleWebKit/537.36 (KHTML, like Gecko) Chrome/114.0.0.0 Safari/537.36 | 5 |
| Mozilla/5.0 (Macintosh; Intel Mac OS X 10_15_7) AppleWebKit/537.36 (KHTML, like Gecko) Chrome/145.0.0.0 Safari/537.36 | 1250 |
| Mozilla/5.0 (iPhone; CPU iPhone OS 13_2_3 like Mac OS X) AppleWebKit/605.1.15 (KHTML, like Gecko) Version/13.0.3 Mobile/15E148 Safari/604.1 | 95 |
| Mozilla/5.0 (Macintosh; Intel Mac OS X 10_15_7) AppleWebKit/537.36 (KHTML, like Gecko) Chrome/147.0.0.0 Safari/537.36 | 1210 |
| Mozilla/5.0 (Windows NT 10.0; Win64; x64) AppleWebKit/537.36 (KHTML, like Gecko) Chrome/150.0.0.0 Safari/537.36 | 1085 |
| Mozilla/5.0 (Windows NT 10.0; Win64; x64) AppleWebKit/537.36 (KHTML, like Gecko) Chrome/144.0.0.0 Safari/537.36 | 1065 |
| Mozilla/5.0 (Macintosh; Intel Mac OS X 10_15_7) AppleWebKit/537.36 (KHTML, like Gecko) Chrome/146.0.0.0 Safari/537.36 | 1205 |
| Mozilla/5.0 (Windows NT 10.0; Win64; x64) AppleWebKit/537.36 (KHTML, like Gecko) Chrome/147.0.0.0 Safari/537.36 | 1190 |
The interesting part is those abort responses the server issued. Turns out, few of those IPs were
already in abort blocks in my Caddyfile (those came from Bob Rudis who once share his rules on Mastodon) but not entire IP range was covered
by rules so some of them got 200 and some of them were aborted.
All public repos were properly scraped by each IP range.
| CIDR | Repo | Requests | IPs | 200 | 403 | Abort |
|---|---|---|---|---|---|---|
| 47.80.0.0/13 | glog:public | 14710 | 1793 | 4700 | 0 | 9970 |
| 47.78.0.0/15 | glog:public | 4615 | 548 | 1650 | 0 | 2940 |
| 47.80.0.0/13 | retrosheetpy:public | 1145 | 214 | 140 | 0 | 995 |
| 47.80.0.0/13 | nordtheme:public | 885 | 172 | 155 | 0 | 730 |
| 47.80.0.0/13 | asnaic:public | 640 | 127 | 135 | 0 | 505 |
| 47.78.0.0/15 | retrosheetpy:public | 400 | 76 | 60 | 0 | 340 |
| 47.78.0.0/15 | nordtheme:public | 305 | 59 | 55 | 0 | 250 |
| 47.78.0.0/15 | asnaic:public | 180 | 36 | 60 | 0 | 120 |
| 47.80.0.0/13 | other (including / and assets) | 105 | 8 | 95 | 0 | 10 |
| 47.89.128.0/17 | other (including / and assets) | 60 | 1 | 20 | 0 | 0 |
| 198.11.128.0/18 | other (including / and assets) | 30 | 1 | 10 | 0 | 0 |
| 47.78.0.0/15 | other (including / and assets) | 25 | 1 | 25 | 0 | 0 |
| 47.77.128.0/17 | other (including / and assets) | 5 | 1 | 0 | 0 | 0 |
| 47.254.0.0/16 | other (including / and assets) | 5 | 1 | 0 | 0 | 0 |
I have added those IPs to another abort block.
There were not seemingly doing anything harmful but the scraping part is annoying.
Scanners
From the number of requests point of view these were the Top-10:
| IP | Requests | ASN |
|---|---|---|
| 34.187.246.40 | 1244 | AS396982 |
| 45.138.12.172 | 566 | AS218785 |
| 20.217.186.29 | 553 | AS8075 |
| 45.115.26.203 | 491 | AS199457 |
| 8.234.49.30 | 486 | AS3356 |
| 8.234.49.30 | 486 | AS396982 |
| 207.175.218.17 | 377 | AS396982 |
| 13.140.161.237 | 342 | AS51167 |
| 16.192.150.116 | 335 | AS16509 |
| 34.220.116.146 | 335 | AS16509 |
| 43.166.206.32 | 335 | AS132203 |
| 102.220.162.137 | 320 | AS197769 |
| 102.133.224.63 | 306 | AS8075 |
| 34.62.31.226 | 294 | AS396982 |
| 34.24.153.243 | 278 | AS396982 |
| 34.51.179.90 | 278 | AS396982 |
| 35.228.99.210 | 278 | AS396982 |
| 35.229.211.165 | 278 | AS396982 |
| 35.235.93.105 | 278 | AS396982 |
| 34.27.201.146 | 277 | AS396982 |
| 34.51.194.104 | 277 | AS396982 |
Checked them all on CrowdSec and the all are highlighted as malicious.
In my case these were mostly doing general scanning, looking for WordPress, php files or env and other secrets.
All these went into another block in Caddyfile.
The week was nothing special overall. The Noise is still out there and it still overwhelming the Signal. Ping me on Mastodon (link down in the footer) if anything here is missing or wrong. I am not an expert in traffic analysis and I am happy to learn from people smarter than me.